vistool theming utilities
vistool_theme.RdLightweight theme model and helpers to manage plotting style in a single place.
Can be used with vistool visualizers via set_theme() or added directly to
ggplot2 plots using the + operator.
Usage
vistool_theme(
  palette = "viridis",
  text_size = 11,
  theme = "minimal",
  alpha = 0.8,
  line_width = 1.2,
  point_size = 2,
  legend_position = "right",
  show_grid = TRUE,
  grid_color = "gray90",
  background = "white"
)
Arguments
- palette
Character. Color palette to use. One of "viridis", "plasma", or "grayscale".
- text_size
Numeric. Base text size for plots.
- theme
Character. ggplot2 theme to use. One of "minimal", "bw", "classic", "gray", "grey", "light", "dark", or "void".
- alpha
Numeric. Transparency level (0-1).
- line_width
Numeric. Default line width for plots.
- point_size
Numeric. Default point size for plots.
- legend_position
Character. Position of legend. One of "top", "right", "bottom", "left", or "none".
- show_grid
Logical. Whether to show grid lines.
- grid_color
Character. Color of grid lines.
- background
Character. Background color of plots.
Examples
th = vistool_theme(palette = "plasma", text_size = 12)
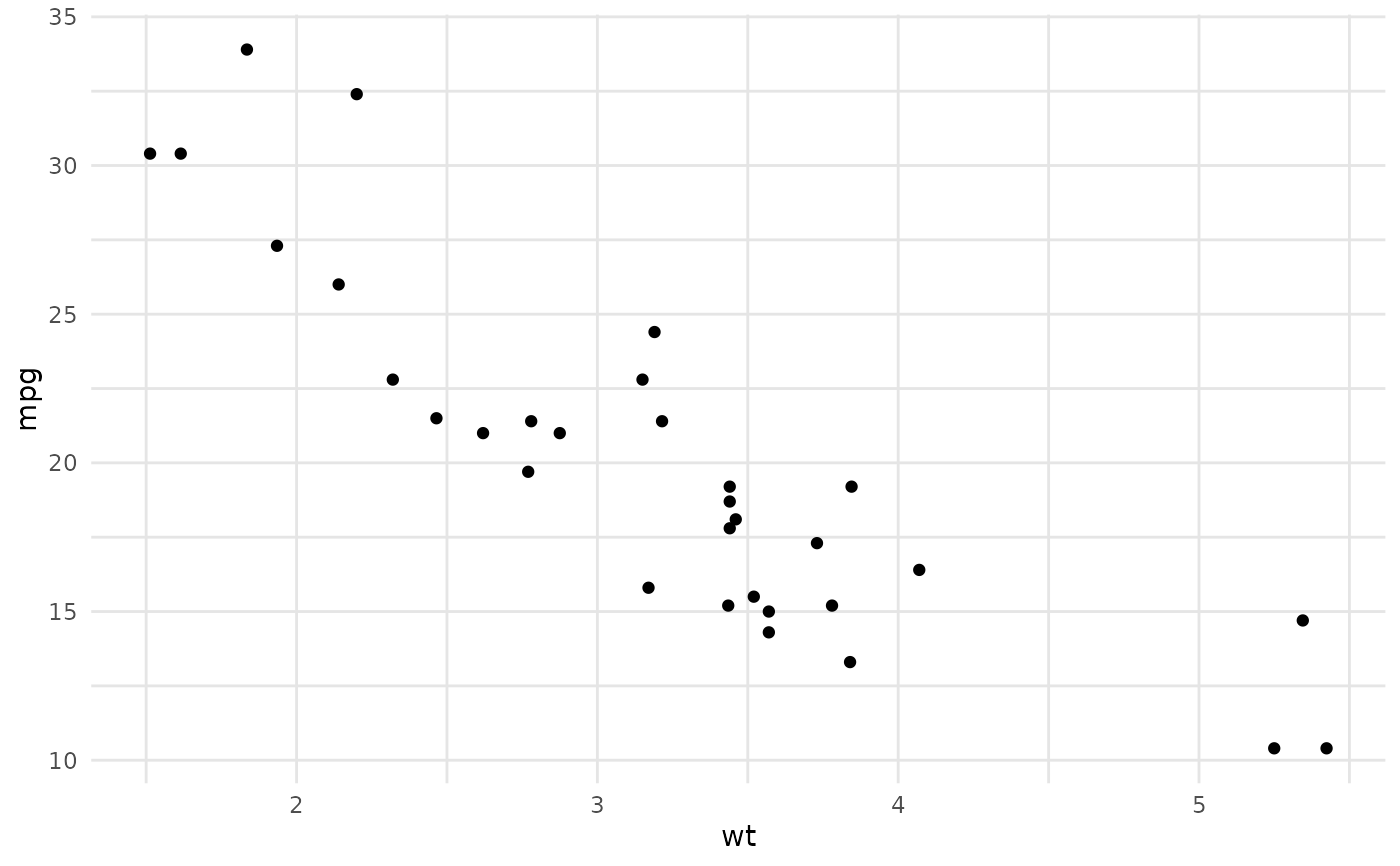
# Use with ggplot2
library(ggplot2)
ggplot(mtcars, aes(x = wt, y = mpg)) +
geom_point() +
vistool_theme()